Threshold Band alerts HOWTO screencast
Trisul Network Analytics 5.5 introduced an extremely nifty feature called Threshold Band Alerting . We’ve talked about that feature in this blog post and in the documentation.
We find that some of our customers are not using the full power of the feature. The key thing to remember is that you can create bands on ANY traffic metric not just total bandwidth. One of our most useful bands in action at a customer site is one we’ve created on “Active Flows”. This has helped catch a number of suspect activity that were invisible if you just looked at total bandwidth.
Here is are two simple screencasts that shows you how to create bands of your own.
Screencast 1 : Create a new band
You can click on any key or inside the charts on the legend to go to the Key Dashboard.
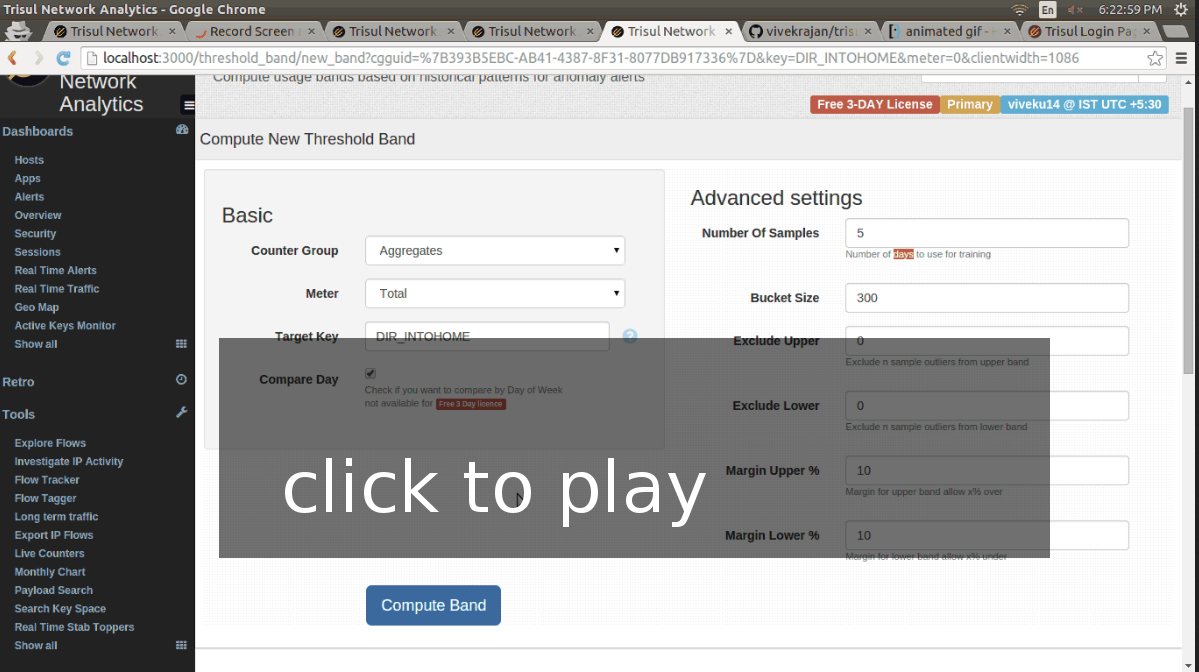
The first screencast shows
- Clicking on a key to navigate to the key dashboard
- In this example – we are creating a band for INBOUND traffic
- Then clicking on Create Threshold Band and going through the form
- Checking the Compare Day box – which only compares Wednesdays with other Wednesdays to create a profile
- Using Number of Samples = 5 – which needs about 5 weeks of training data
Screencast 2 : Viewing alerts and bands
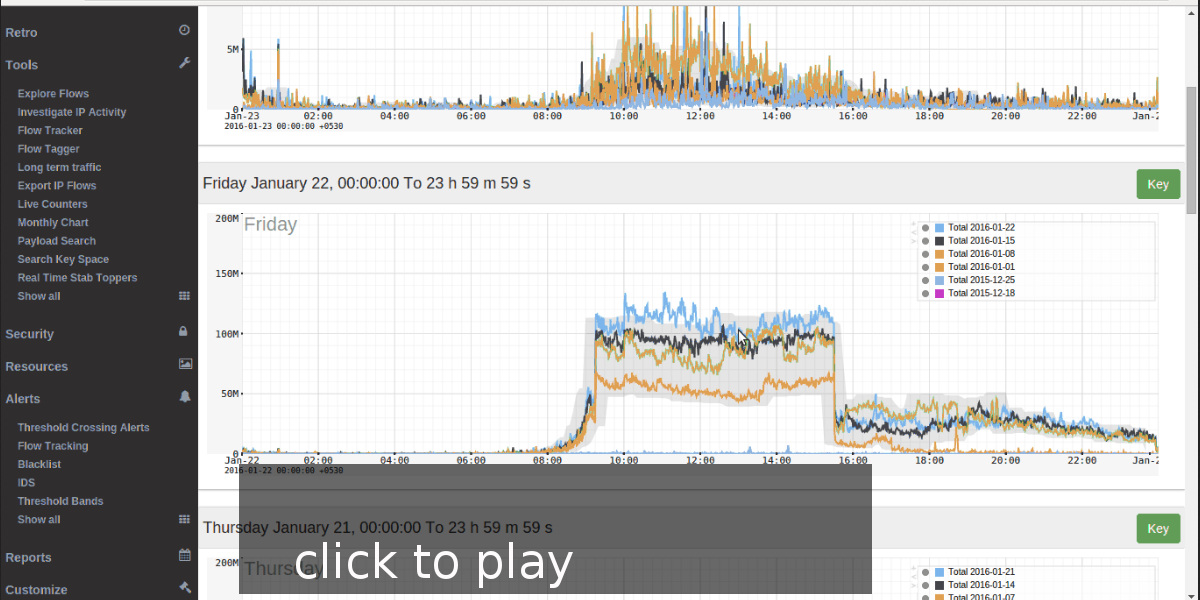
Shows you how to view alerts and also to see the internals of how bands are calculated, how our algorithm excludes outliers at a data-series level as well as at an interval level.
The screencast shows
- Sample of how alerts are shown on the charts
- Clicking on a Alerts > Threshold Band to go to the alerts page
- The next page shows alerts that have fired, clicking on “Configure”
- Clicking on “View All Days” to see all band along with the training data
Get New Builds
We just uploaded new builds of Trisul 5.5. We encourage you to update.
We will also be releasing Trisul 6.0 a major new release in the next few weeks. Stay tuned and share your experiences with us.
 Free Download Trisul 5.5
Download Trisul 5.5 today Spend your time on interesting problems not fighting tools.


