Announcing Trisul-Probe docker image and new distributed monitor features
We just released new builds of Trisul Network Analytics 6.5 with some exciting updates.
Trisul Network Analytics is a distributed monitoring platform. In the distributed setup, a network of “Probe nodes” can report to one or more “Hub nodes”. We provide Ubuntu/CentOS/RHEL packages for the probe and hub nodes. But we really like Docker for its sheer ease of deployment and upgrades. We already have a popular Docker Image with over 10K pulls for our single-node solution called trisulnsm/trisul6
Today we are excited to release a new Docker image of Trisul-Probe that lets you roll out a new probe in under 3 minutes.
This blog post is a quick tour of the distributed management features you can find in this release.
Nodes in a Trisul Domain
The ‘domain0’ is the special default domain where all Trisul hub and probe components join. The following diagram shows 9 probes and 1 hub node in domain0. In very large deployments , you might want to have two or three hub nodes. The database is distributed between the hubs. All components talk to the domain using Protocol Buffers over ZeroMQ.
The probe nodes store the raw packets and the hub nodes store everything else. On the Trisul Web GUI, the analyst can choose to view a single probe or “All Probes”. When “All Probes” is chosen, the Trisul-Hub reduces query results from all probes and presents a consolidated view. For example : Total HTTPS Bandwidth from all probes will ADD the bandwidth seen on all probes.
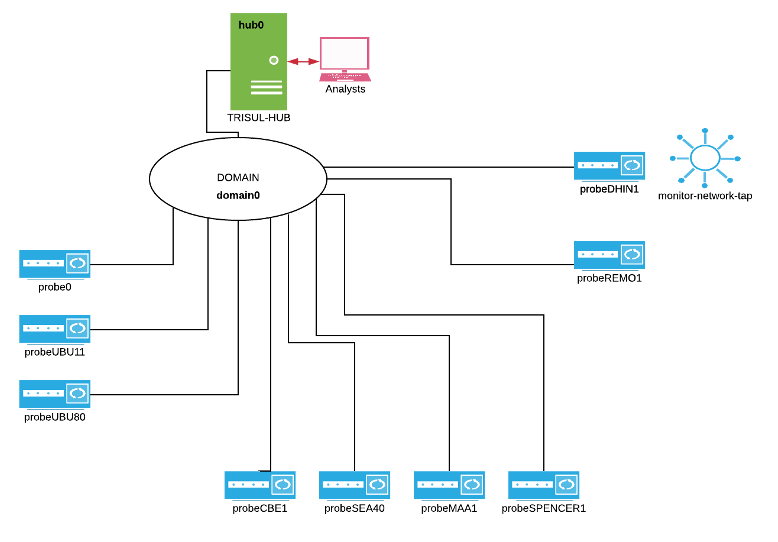
Showing 9 probes and 1 Hub in a Trisul distributed domain
Probe Management
The domain nodes can be managed from the web GUI or from the CLI tool. You can start/stop each probe separately or configure them to use different capture mechanisms. Logging in as admin, you will see something like below.
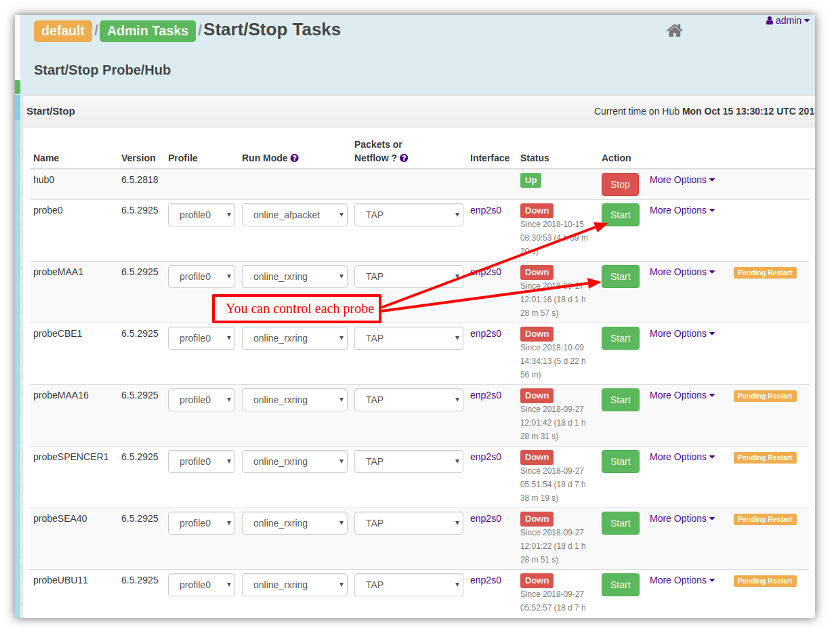
The probe management tool lets to start stop and configure each probe separately
Probe CLI
Trisul Probe and Hub nodes include a powerful CLI tool (Command Line Interface) with autocomplete and inline help. Power users will like the CLI tool to accomplish tasks much faster. The following screencast introduces some basic commands you can use to manage multiple probes. See Documentation for trisulctl_hub and trisulctl_probe CLI tools
Click to play
Probe menu to switch probes
When you login as a user into a distributed Trisul domain, you will by default see a “All Probes” view. All metrics, flows, alerts will be combined from all probes. You can change this by selecting from the probe menu shown below.
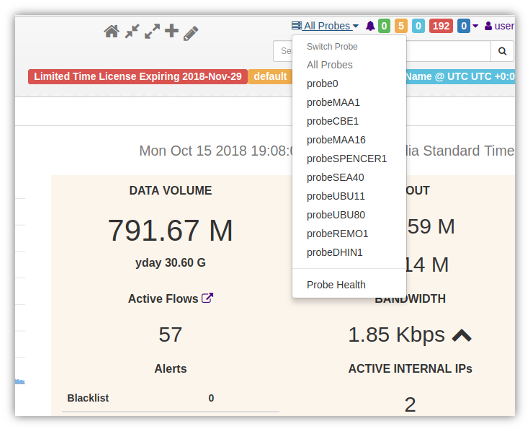
You can select a single probe or All Probes
Probe health
Probes can go offline, networks can be slow, or Trisul processes on the probe may have stopped. The Probe Health dashboard shows the following for each probe in a dashboard
- reachable
- is the probe reachable by the network
- up/down
- is the probe processes and running
- latency
- if reachable – latency using PING to the probe node for past 1 hour
- bandwidth
- shows the bandwidth seen at the probe in the past 1 hour
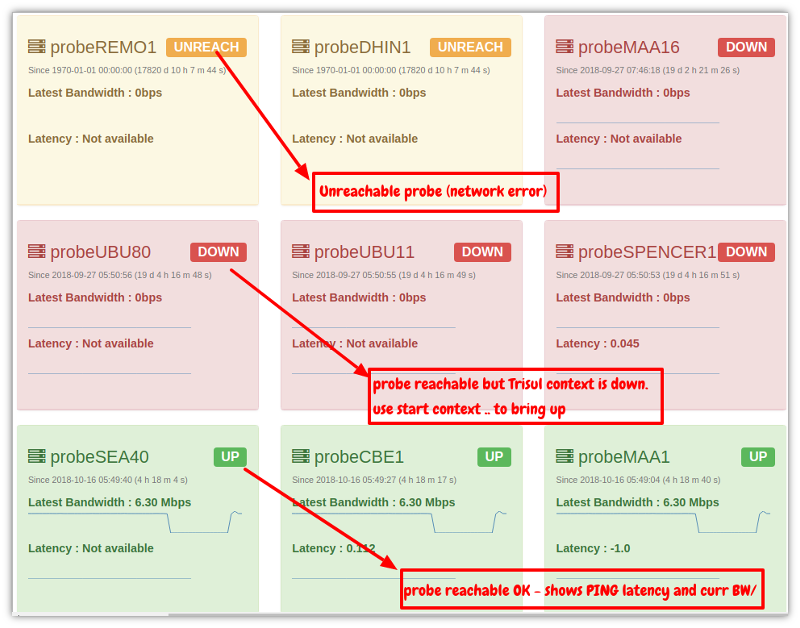
One page showing probe reachability, error, latency, and current bandwidth
Multi Probe Charts
We got a few requests from our users for cross-probe reports, such as
“We want to plot a metric, say Total Bandwidth IN/OUT, for each probe on a single dashboard”.
We recently released a new Trisul APP called Multi Probe Charts Installing this chart gives you a new Dashboard that allows to run a parallel metrics query for each probe and put the results on a single dashboard. You can then use the probe selector to zoom in on a particular probe.
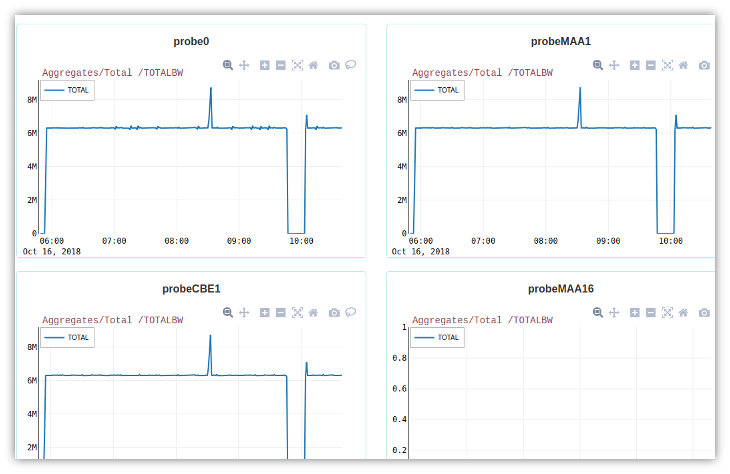
Show the same metric from multiple probes. Here we are showing in 1-min real time Bandwidth IN/OUT
For full release notes – see our forum announcement
Happy monitoring!
We are bringing advanced new features in every release cycle.
 Free Download Trisul 6.5 ! Get started now.
