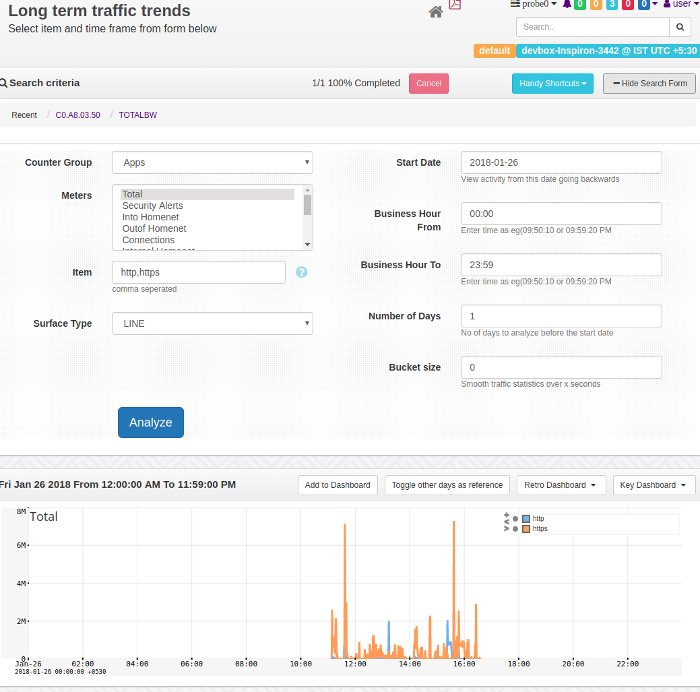
14.6. Analyze Item
Purpose : Show long term traffic trends of a particular item.
View traffic trends for a particular item. You can specify a time window and a number of days. Trisul draws charts one below the other, aligned by time. This allows you to view daily, hourly, patterns in traffic for that item.
14.6.1 How to use
To access select Tools → Long term traffic
| Field | Description | |
|---|---|---|
| Key | Key + Counter Group identifies what item you want to see | |
| CounterGroup | Key + Counter Group identifies what item you want to see | |
| Meters | Multiple select box allows you to see many meters on the same chart | |
| From Date | Ending date , this along with the Days parameters decides how far back you want to see | |
| From Time | Only show data in this time window (along with To Time) for each day | |
| To Time | See From Time | |
| Days | Number of days | |
| Surface Type | Select a chart surface type. Tip : Choose LINETABLE if you want to see a box with MAX/MIN/AVG below chart |

Long Term Traffic
- Example
- If you wanted to plot total http traffic during business hours for the past week.
| Counter Group | Apps |
| Key | http (or Port-80 or p-0050) |
| From Date | 8AM (ignore the day) |
| To Date | 5PM |
| Days | 7 |