13.8. Netflow Sources Dashboard
The Netflow Sources dashboard provide you the following system level information on a Time Series chart.
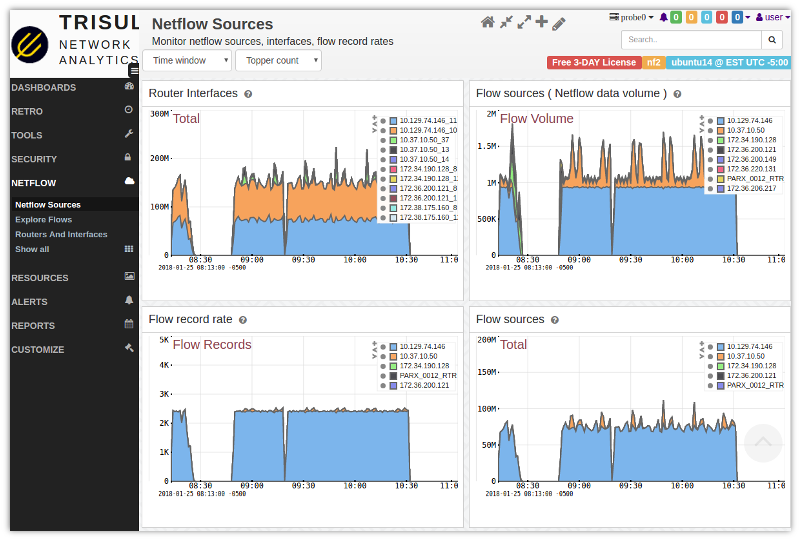
Per Router (flow exporter)
- Flow record Rate — number of flows per second per router being processed
- Flow sources — bandwidth per router
- Flow volume — netflow bandwidth. This is an important parameters. Shows the Netflow Record rate in Mbps
Per Interface
- Total volume — bandwidth of Top 10 interfaces
13.8.1 Using
Select Netflow → Netflow sources to open the dashboard
Things to try :
- Expand timeframe using the “Time Window” drop down on the top
- Click on any item inside the chart legend to drilldown into long term views
- Click on to add any chart as a Reference chart to others. This allows you to compare different panels.